The Supertrend — Implementing, Screening & Backtesting in Python
Everything you need to know about this simple yet powerful indicator.
medium.datadriveninvestor.com

- Introduction to the Supertrend
- Implementation in Python: calculation & visualization
- Backtesting & parameter optimization
- Screening
1. Supertrend
Supertrend는 ATR(Average True Range)과 간단한 고저 평균을 사용하여 더 낮은 값을 형성하는 추세 추종 지표입니다.
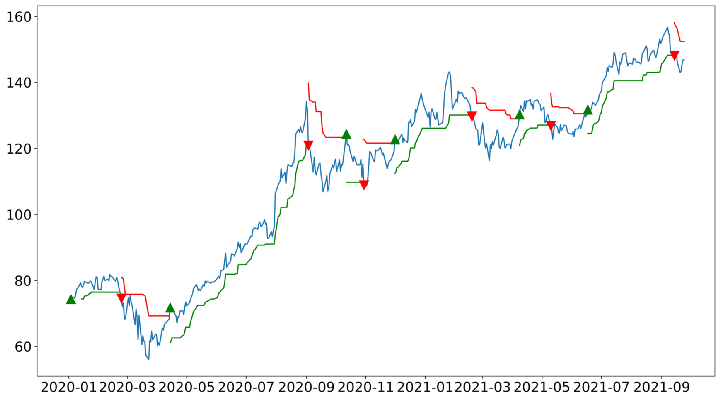
상단 밴드. 지표의 요지는 종가가 상단 밴드를 넘을 때 주가가 상승 추세에 진입한 것으로 간주되어 매수 신호입니다.
종가가 하단 밴드 아래로 교차하면 해당 주식은 추세를 이탈한 것으로 간주되어 매도 시점입니다.
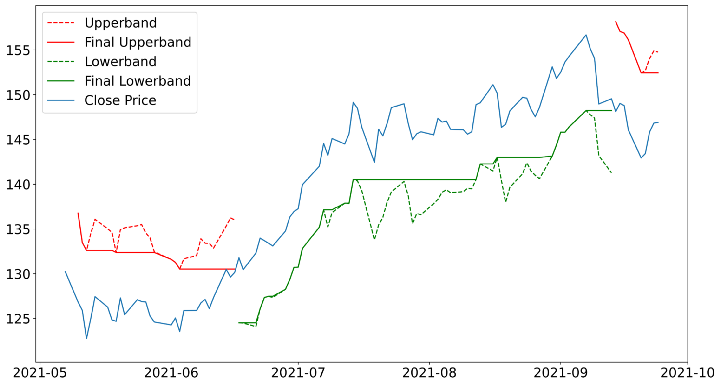
많은 차트 플랫폼에서 Supertrend는 일반적으로 위쪽 밴드는 빨간색으로 아래쪽 밴드는 녹색으로 표시됩니다.
2. 구현
HL2 = (high + low)/2
MULT is just a constant multiplier, and
ATR is the average of True Range (TR), which is simply the maximum value of 3 price differences: max[(high-low), |high — previous close|, |previous close — low|] .
UPPERBAND = HL2 + MULT * ATR
LOWERBAND = HL2 - MULT * ATR

최종 상위 대역은 더 높은 상위 대역 값이 있을 때까지 동일하게 유지되며 그 반대의 경우도 마찬가지입니다.
import pandas as pd
import numpy as np
from datetime import datetime
import yfinance as yf
import math
import matplotlib.pyplot as plt

def Supertrend(df, atr_period, multiplier):

    high = df['High']
    low = df['Low']
    close = df['Close']

    # calculate ATR
    price_diffs = [high - low,
                   high - close.shift(),
                   close.shift() - low]
    true_range = pd.concat(price_diffs, axis=1)
    true_range = true_range.abs().max(axis=1)
    # default ATR calculation in supertrend indicator
    atr = true_range.ewm(alpha=1/atr_period,min_periods=atr_period).mean()
    # df['atr'] = df['tr'].rolling(atr_period).mean()

    # HL2 is simply the average of high and low prices
    hl2 = (high + low) / 2
    # upperband and lowerband calculation
    # notice that final bands are set to be equal to the respective bands
    final_upperband = upperband = hl2 + (multiplier * atr)
    final_lowerband = lowerband = hl2 - (multiplier * atr)

    # initialize Supertrend column to True
    supertrend = [True] * len(df)

    for i in range(1, len(df.index)):
        curr, prev = i, i-1

        # if current close price crosses above upperband
        if close[curr] > final_upperband[prev]:
            supertrend[curr] = True
        # if current close price crosses below lowerband
        elif close[curr] < final_lowerband[prev]:
            supertrend[curr] = False
        # else, the trend continues
        else:
            supertrend[curr] = supertrend[prev]

            # adjustment to the final bands
            if supertrend[curr] == True and final_lowerband[curr] < final_lowerband[prev]:
                final_lowerband[curr] = final_lowerband[prev]
            if supertrend[curr] == False and final_upperband[curr] > final_upperband[prev]:
                final_upperband[curr] = final_upperband[prev]

        # to remove bands according to the trend direction
        if supertrend[curr] == True:
            final_upperband[curr] = np.nan
        else:
            final_lowerband[curr] = np.nan

    return pd.DataFrame({
        'Supertrend': supertrend,
        'Final Lowerband': final_lowerband,
        'Final Upperband': final_upperband
    }, index=df.index)


atr_period = 10
atr_multiplier = 3.0

symbol = 'AAPL'
df = yf.download(symbol, start='2020-01-01')
supertrend = Supertrend(df, atr_period, atr_multiplier)
df = df.join(supertrend)
차트
# visualization
plt.plot(df['Close'], label='Close Price')
plt.plot(df['Final Lowerband'], 'g', label = 'Final Lowerband')
plt.plot(df['Final Upperband'], 'r', label = 'Final Upperband')
plt.show()
3. 백테스팅
def backtest_supertrend(df, investment):
    is_uptrend = df['Supertrend']
    close = df['Close']

    # initial condition
    in_position = False
    equity = investment
    commission = 5
    share = 0
    entry = []
    exit = []

    for i in range(2, len(df)):
        # if not in position & price is on uptrend -> buy
        if not in_position and is_uptrend[i]:
            share = math.floor(equity / close[i] / 100) * 100
            equity -= share * close[i]
            entry.append((i, close[i]))
            in_position = True
            print(f'Buy {share} shares at {round(close[i],2)} on {df.index[i].strftime("%Y/%m/%d")}')
        # if in position & price is not on uptrend -> sell
        elif in_position and not is_uptrend[i]:
            equity += share * close[i] - commission
            exit.append((i, close[i]))
            in_position = False
            print(f'Sell at {round(close[i],2)} on {df.index[i].strftime("%Y/%m/%d")}')
    # if still in position -> sell all share
    if in_position:
        equity += share * close[i] - commission

    earning = equity - investment
    roi = round(earning/investment*100,2)
    print(f'Earning from investing $10000 is ${round(earning,2)} (ROI = {roi}%)')
    return entry, exit, equity

entry, exit, roi = backtest_supertrend(df, 10000)
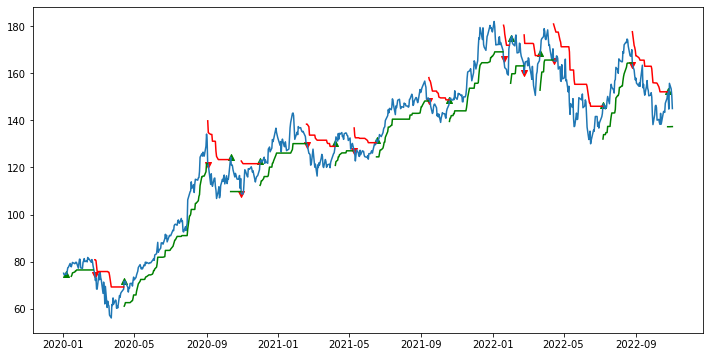
차트
# visualization
plt.figure(figsize=(12,6))
plt.plot(df['Close'], label='Close Price')
plt.plot(df['Final Lowerband'], 'g', label = 'Final Lowerband')
plt.plot(df['Final Upperband'], 'r', label = 'Final Upperband')
for x,y in entry:
    plt.scatter(x=datetime.strptime(x, '%Y-%m-%d'), y=y, c="green", marker="^")
for x,y in exit:
    plt.scatter(x=datetime.strptime(x, '%Y-%m-%d'), y=y, c="red", marker="v")

plt.show()
4. 종목 검색
다음 코드는 먼저 S&P 500 주식 목록의 각 기호를 살펴보고 방금 Supertrend에 진입한 종목을 걸러냅니다.
# get the full stock list of S&P 500
payload = pd.read_html('https://en.wikipedia.org/wiki/List_of_S%26P_500_companies')
stock_list = payload[0]['Symbol'].values.tolist()
supertrend_stocks = []
# loop through each symbol
for symbol in stock_list:
    try:
        df = yf.download(symbol, start='2021-01-01', threads= False)
    except Exception as e:
        print(e)
    if len(df) == 0: continue
    supertrend = Supertrend(df, atr_period, atr_multiplier)
    if not supertrend['Supertrend'][-2] and supertrend['Supertrend'][-1]:
        supertrend_stocks.append(symbol)

print(supertrend_stocks)'암호화폐주식투자' 카테고리의 다른 글
| 암호화폐 거래를 위한 퀀트 강좌(bing gpt-4) (0) | 2023.03.27 |
|---|---|
| 암호화폐 거래를 위한 퀀트 강좌(feat GPT-3) (0) | 2023.03.27 |
| Bitget 암호화폐 거래소 Futures Grid Trading Bot (암호화폐 선물 자동거래 봇) (1) | 2022.09.01 |
| Kucoin(쿠코인) / Binance (바이낸스) 암호화폐 거래소 비교 (4) | 2022.05.25 |
| การแลกเปลี่ยนสกุลเงินดิจิตอลรายวัน Kucoin มีผู้ใช้ถึง 10 ล้านคน (3) | 2022.05.23 |